Fibozachi – The Vol. T Volume-Tick Indicator Package
$80.00$645.00 (-88%)
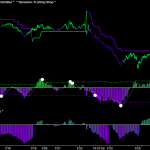
As you can see in the screenshots below, using the Vol.T™ Indicators with the NinjaTrader Market Analyzer,
Fibozachi – The Vol. T Volume-Tick Indicator Package
Check it out: Fibozachi – The Vol. T Volume-Tick Indicator Package


The only Indicator Package of its kind, Vol.T™ diagnoses volume-trend and tick-pressure to provide trading signals based on buying or selling pressure (rather than just movements in price).
The Vol.T™ Indicator Package contains the most comprehensive and diverse collection of volume-based and tick-based trading indicators available on the commercial market. By approaching volume analysis from every possible angle, the Vol.T™ Indicators let you use volume and tick data more effectively than ever before. Whether you’re a trend-trader or a scalper, Vol.T™ provides volume analysis techniques that are essential for intraday trading.

The Vol.T: Volume-Tick Indicator Package includes:
 Vol.T™ Trigger
Vol.T™ Oscillator
Vol.T™ PaintBar
Vol.T™ MoneyFlow
Vol.T™ MoneyFlow Cumulative
Vol.T™ PVT
Vol.T™ PVT Cumulative
Vol.T™ TSV
Vol.T™ TSV ROC
*** Vol.T™ also Includes Specialized Scanner Versions for EVERY Indicator ***
* Scanners are designed for use with the NinjaTrader Market Analyzer, TradeStation RadarScreen, and MultiCharts Market Scanner
*** BONUS: Also Includes the Dynamic Trailing Stop (DTS) — A $95 Value ***
 Dynamic Trailing Stop (DTS) Indicator
Dynamic Trailing Stop PaintBar
Dynamic Trailing Stop Market Analyzer (NinjaTrader)
Dynamic Trailing Stop RadarScreen (TradeStation)
Dynamic Trailing Stop Market Scanner (MultiCharts)

— Calculating Tick-Pressure —

The Vol.T™ Trigger continuously calculates current and historical “Tick-Pressure” for any symbol that has tick data — showing you exactly when and where buying pressure, selling pressure, and profit-taking occur. This enables you to see turns or shifts the instant that they occur — allowing for earlier trade entries and enhanced risk/reward ratios. By combining the position and slope of the Vol.T Trigger relative to the ZeroLine, you can accurately diagnose the true internals of any instrument that has tick data.
The Vol.T Trigger combines 4 separate calculations to plot one of the smoothest, most accurate Tick-based Indicators available by:
1) Compiling all Tick Data during each bar in real-time, counting Cumulative Ticks, Upticks, and Downticks
2) Analyzing multiple Tick-Ratio and Tick-Spread calculations for the current bar
3) Comparing these values against all Tick-Ratios and Tick-Spreads of the Vol.T Length (amount of bars) to calculate a value for Tick-Pressure
4) Applying a smoothing factor to both the value and slope of the Vol.T Trigger
Gradient Color-Coding
The Gradient Color-Coding option uses a blend of colors to plot the Vol.T Trigger based on it’s position relative to the ZeroLine.
High Values = Green
Low Values = Purple
Slope Color-Coding
The Slope Color-Coding option uses color-codes the Vol.T Trigger based on the direction of it’s slope.
Sloping Up (increasing) = Green
Sloping Down (decreasing) = Purple

— Synthesizing Volume, Price and Volatility —

The Vol.T™ Oscillator combines volume, price, and volatility to measure the overall trend of a trading vehicle. This trend calculation is then smoothed and plotted as a value that oscillates between positive and negative values.
The value plotted on the right axis references a complex volume calculation that is different for each trading vehicle and interval period. Instances of extremely high or low values often show where cumulative buying or selling pressure reaches an unsustainable extreme — typically leading to an immediate reversal.
By combining the color, slope, and position of the Vol.T™ Oscillator relative to the ZeroLine, you can accurately diagnose the true internals of any trading vehicle that has volume data.

— Color-Coding Your Charts —

The Vol.T™ PaintBar is a visual aid that color-codes each bar according to the Vol.T™ Oscillator’s values. This lets you immediately identify the underlying Volume-Trend without the need for any indicator subpanels.
You can select between Gradient or Slope Color-Coding options — showing you shifts or divergences between volume and price as they occur.
When price makes new highs without Green colored bars, we know that volume and price are in disagreement — this implies that the upward trend is losing steam and may not be sustainable.
When price makes new lows without Purple colored bars, we know that volume and price are also in disagreement — this implies that the downward trend is losing steam and may not be sustainable

— Calculating the “Price-Volume” Trend —

The Vol.T™ PVT Indicator determines the “Price-Volume Trend” for any symbol that has volume data. To do so, it calculates “Up Volume” and “Down Volume” in a unique way that it is based entirely upon the price action of each bar. While this may seem counterintuitive, it is a very effective way of diagnosing the underlying trend based on a harmonious balance between Price and Volume. “Up Volume” and “Down Volume” values are calculated by analyzing various relationships between the Open, High, Low, and Close of each bar.

— Diagnosing Trending and Sideways Markets —

The Vol.T™ Cumulative PVT shows the cumulative PVT value throughout the entire trading session (based on user-defined start/end times).
By using the PVT Cumulative mode, a new PVT Total is calculated starting with the first bar of each session. Rather than showing the PVT over the last “X” amount of bars (i.e. a 14-period PVT), the PVT Cumulative updates after each bar to show you the volume-trend throughout the entire session. By monitoring the Cumulative PVT, you can easily and accurately determine if there is a harmonious relationship between price and volume.

— Calculating the “Money-Trend” —

The Vol.T™ MoneyFlow Indicator utilizes a special ratio of Price and Volume to diagnose the internal health of any symbol. It calculates the “Money-Trend” by analyzing price and volume fluctuations that occur during each bar.
By monitoring the Vol.T™ MoneyFlow, traders can determine the strength and direction of the “Money-Trend” over the last “X” bars. Ideally, both price and volume should be moving in unison during both uptrends and downtrends. By only trading in the same direction as the “Money-Trend”, you can avoid bad trades and have confidence that you are trading alongside a healthy trend of both price and volume.

— Diagnosing the Health of each Trading Session —

The Vol.T™ MoneyFlow Cumulative shows the cumulative “MoneyFlow” value throughout the entire trading session (based on user-defined start/end times).
By using the MoneyFlow Cumulative mode, a new MoneyFlow Total is calculated starting with the first bar of each session. Rather than showing the MoneyFlow over the last “X” amount of bars (i.e. a 14-period MoneyFlow), the MoneyFlow Cumulative updates after each bar to show you the “Money-Trend” throughout the entire session. By monitoring the Cumulative MoneyFlow, you can easily and accurately determine if there is a harmonious relationship between price and volume.

— Time-Segmented Volume Analysis —
The Vol.T™ TSV Indicator uses the unique concept of Time-Segmented Volume Analysis, which lets you visualize and interpret volume data much more effectively than traditional methods.
There are inherent flaws that exist when analyzing raw volume data:
- The open of each trading session has a very large amount of volume
- The close of each trading session has a very large amount of volume
- The middle of each trading session (lunch hours) has very low volume
These flaws skew and distort volume data, which renders it virtually useless to traders and technicians. Analyzing volume for the day proves to be ineffective because it offers little insight into when and where important buy/sell orders actually took place. Therefore, the only way to effectively gauge the volume of each bar during a trading session is to compare it to the average volume for the same exact bar during previous trading sessions, which is exactly what the Vol.T™ TSV Indicator does.
— A Comparison of TSV vs. Volume —
The Vol.T™ TSV Indicator plots volume as a percentage for each bar during the trading day. It works by comparing the volume of each bar to the average volume of the same exact bar over the previous “X” trading days.
Example (Using 5-minute chart and 30 days of Historical Price Data)
► If the Vol.T™ TSV has a value of “500” at 1:30 pm, it means that the volume of the 5-minute bar at 1:30pm is 500% greater than the average volume of the 1:30 pm bar over the last 30 trading days.
TSV (White) vs. Volume (Yellow)
The screenshots below show a comparison of traditional volume vs. Vol.T TSV™ for an entire trading day … note how only Vol.T TSV™ reveals the ‘true’ volume profile of each bar.


— Volume-Based Volatility —

The Vol.T™ TSV ROC Indicator shows the average rate of change of the Vol.T™ TSV. Again, using a Rate of Change (ROC) indicator with normal volume results in the same exact scenario each and every trading session …
- Start of Session = High Volatility
- Middle of Session = Low Volatility
- End of Session = High Volatility
We resolved this issue by creating a ROC indicator based on the Vol.T™ TSV — allowing you to see when and where volume-based volatility truly occurs. The result is a more effective and useful ROC indicator that reveals a unique story for volatility during each trading session.
Spot Divergences — Automatically!
State-of-the-Art “Divergence Engine”
— Automatic Divergence Detection —
The Vol.T Oscillator includes our state-of-the-art “Divergence Engine”, which automatically detects bullish and bearish divergences between the Indicator and Price. When a valid divergence is detected, the Oscillator automatically draws a divergence trendline directly onto the chart — alerting you to the increased likelihood of a price reversal. It also includes fully customizable audio and visual alerts to ensure you won’t miss any divergence signals. Our Divergence Engine is truly the most effective and customizable tool of its kind!
Innovative and Powerful Features:

Automatically Detects Bullish and Bearish Divergences
Draws Color-Coded Divergence Trendlines on the Price Chart / Sub-Panel
Issues Customizable Alerts for All Divergence Signals
“Filtered Divergences” Mode Detects the Most Powerful Divergence Signals *
Identifies “Long-Term Divergences” by Using Multiple Highs / Lows *
Adjustable “Divergence Lookback Length” and “Left / Right Pivot Strength” *
* These proprietary features and capabilities are exclusive to our Divergence Engine — you won’t find them anywhere else!
Vol.T™ Oscillator Bullish Divergence (Positive Divergence)

Vol.T™ Oscillator Bearish Divergence (Negative Divergence)

Want to Scan for Signals? It’s Easy…
Automated Signal Scanning
— Divergences, Reversals and Crossovers —
The Vol.T™ Indicator Package also includes special “Scanner” Indicators designed to scan for signals and trend conditions using the NinjaTrader Market Analyzer, TradeStation RadarScreen, or MultiCharts Market Scanner. And all columns, colors, and text are fully customizable!
As you can see in the screenshots below, using the Vol.T™ Indicators with the NinjaTrader Market Analyzer, TradeStation RadarScreen, or MultiCharts Market Scanner allows you to scan any list of symbols — in just seconds!
NinjaTrader Market Analyzer – Vol.T™

TradeStation RadarScreen – Vol.T™

MultiCharts Market Scanner – Vol.T™