Ben Collins – Build Dashboards With Google Sheets
$47.00$199.00 (-76%)
Learn how to create interactive dashboards in Google Sheets. Benefit from efficient reporting and take your career to the next level.
Ben Collins – Build Dashboards With Google Sheets
Check it out: Ben Collins – Build Dashboards With Google Sheets
Learn how to create interactive dashboards in Google Sheets. Benefit from efficient reporting and take your career to the next level.
Do you spend hours collecting data, wrestling it into the format you need and then updating the same report that no one ever reads?
Or maybe you’re neck deep in data but don’t know how to use it to make sound business and marketing decisions?
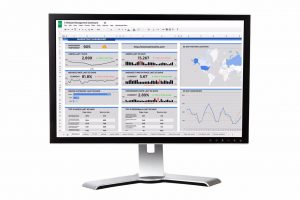
Dashboards give you a high-level overview of your business, showing KPIs, trends and data comparisons… so you can use that insight to grow in smart ways.
By learning some relatively simple techniques, you can create dashboards that are automated, interactive and visually appealing.
This course will set you up to:
Have the confidence to build your own dashboards with your own datasets
Know what to include in your dashboards to maximize their impact
Have the technical skills to manage advanced dashboard projects without feeling overwhelmed
Create interactive dashboards, so colleagues and clients can view the data they want to see
Understand and use best practices in Google Sheets, to avoid making the same mistakes I made
Be confident using advanced formulas and pivot tables
Use Apps Script to automate processes and make your dashboards work for you!
Each lesson is taught through bite-sized, action-oriented 5 – 10 minute-long videos, covering practical techniques you can apply to your own business.
I’ll be with you every step of the way, showing you the sheet setup, the formulas and the charts we use.
For each example you’ll have all the necessary raw data and formulas, as well as a final, finished template!
I’ll tell you more about the course in a moment…
…but first let me reassure you:
I’ve made just about every mistake in the book
Prior to consulting and creating courses, I worked as a forensic accountant, doing investigations into sanctions violations at large financial organizations.
I remember the first time I built a dashboard in Excel at work.
After a lot of headaches and frustration, I had created a presentable dashboard that gave our team oversight of whole dataset.
The dashboard wasn’t pretty, and it probably violated dashboard best principles, but it worked. It was dynamic and I clearly remember how cool that was.
However, I had no idea what I was doing. I barely even knew what dashboards were, and I certainly didn’t know there were courses and books out there that could have saved me hours and hours (and resulted in a better end product!).
Seeing the team interact with the dashboard, I realized how valuable solid data and spreadsheet skills were — something we address throughout this course.
Fast forward to today
Today I create online courses and write about working with data, with a particular focus on how-to articles for learning data analytics and building dashboards, using Google Sheets, Apps Script and Data Studio.
Since mid-2015, I’ve been working as a freelance spreadsheet developer, data consultant and instructor.
I’ve taught data analysis and visualization courses and workshops at General Assembly’s Washington, D.C., campus and privately for clients.
What are dashboards?
Dashboards are high-level summaries of your organization’s data, displayed side-by-side in a single page to highlight the key metrics and trends at a glance. They’ll help you:
Quickly understand the pulse of your business
Visually summarize key metrics for stakeholders who don’t have time to review the data
See new insights with your data side-by-side
Explore the data with interactive features
Speed up and automate your reporting pipeline
Here’s how you might use dashboards:
Show growth of your website or clients’ websites, by tracking traffic and social media metrics over time.
Understand your business better by collecting and analyzing user data in real-time.
Compare sales data across different time periods, sales channels or geographic regions to get deeper insights into your opportunities.
Measure student attendance and performance to easily see where to allocate resources.
Track and visualize financial data to uncover high- and low-performing areas of your company, so you can make adjustments going forward.
Earlier this year I ran a couple of webinars, and here’s what some folks were saying about this Google Sheets dashboard training course:
Enroll now to get:
✅ Actionable, bite-size video lessons that walk you step-by-step through techniques
✅ Access to all the raw data files
✅ Copies of the finished dashboard templates, which you can copy as many times as you like
✅ Access to the private course Facebook group for Q&A
✅ Certificate upon completion
Who is this course for?
Anyone who works with data in Google Sheets.
Someone who is curious to learn more about Google Sheets and dashboards.
Maybe you’re a data analyst, a technical marketer, an educator, a scientist or someone in between.
Anyone who wants to add new a skill, building dashboards, that will help you advance your career.
What are the prerequisites?
A Google account.
Access to Google Sheets.
Basic familiarity with Google Sheets and spreadsheets, although the first couple of dashboards are set up so that everyone should be able to follow along.
Access to a Google Analytics account to get the most out of the Digital Marketing dashboard lectures.
Class Curriculum
Chapter 1: Course Introduction
Preview
Lesson 1: Introduction (3:28)
Preview
Lesson 2: About the Author (2:20)
Preview
Lesson 3: How is this course structured? (1:22)
Start
Lesson 4: Why use Google Sheets to build your dashboards? (4:25)
Start
Lesson 5: What is a dashboard? (6:28)
Start
Google Sheets Chart Tool Update (3:13)
Start
Join the course Facebook Group
Chapter 2: Static Sales Dashboard
Preview
Lesson 6: Introduction to the Static Sales Dashboard (1:20)
Preview
Lesson 7: The raw data (8:34)
Start
Lesson 8: Setting up the Summary Data Table (4:00)
Start
Lesson 9: Introduction to Pivot Tables (7:56)
Start
Lesson 10: Creating the Revenue Chart (2:19)
Start
Lesson 11: Using Pivot Tables to breakdown Sales by Channel (5:21)
Start
Lesson 12: Creating the Sales Channel Chart (2:04)
Start
Lesson 13: More pivot table practice! (4:27)
Start
Lesson 14: Creating a Geographic chart to show sales by US State (3:18)
Start
Lesson 15: Advanced features of pivot tables to find the Top 10 products (4:54)
Start
Lesson 16: Building our Sales Dashboard Part 1 (9:46)
Start
Lesson 17: Building our Sales Dashboard Part 2 (2:30)
Start
Lesson 18: Building our Sales Dashboard Part 3 (9:13)
Start
Lesson 19: Building our Sales Dashboard Part 4 (3:39)
Start
Lesson 20: Sharing your dashboard (9:21)
Chapter 3: Dynamic dashboards
Preview
Lesson 21: Interactive dashboard introduction (1:38)
Start
Lesson 22: The raw data for the interactive dashboard (4:56)
Preview
Lesson 23: Named ranges in Google Sheets (alternative method to lesson 23) (4:38)
Start
Lesson 24: Interactive dashboard data validation (4:57)
Start
Lesson 25: Interactive dashboard staging tables 1 (10:24)
Start
Lesson 26: Interactive dashboard staging tables 2 (10:59)
Start
Lesson 27: Dynamic charts (4:42)
Start
Lesson 28: Interactive dashboard build 1 (15:24)
Start
Lesson 29: Interactive dashboard build 2 (6:27)
Plus, you’ll also get the following resources:
💡 Templates!
At the beginning of each module are templates with the raw datasets and solution files, available for your use, saving you hours of time.
Here’s a sample of what you can expect with the templates:
Each chapter includes:
The raw dataset (where required)
The solution
These resources alone will save you hours and hours of valuable time.
💡 Access to the private course Facebook group
Your enrollment is backed up with support.
There’s a private Facebook group for students, where you can ask questions, share your insights and knowledge, share your wins, and connect with other students.
I’ll be hanging out there to answer your questions.
💡 Lifetime access to the course
Your enrollment in Build Dashboards with Google Sheets comes with lifetime access to the course material.
That way you can take a break from the material if you’re out of town, on vacation, or just swamped for a few days.
Interruptions happen, and your course videos will ALWAYS be here for you when you’re ready. This lifetime access also includes all future updates and upgrades at no extra charge.
This is my way of ensuring that Build Dashboards with Google Sheets remains an excellent long-term investment for you and your business.
💡 Certificate of Completion
Want to show off your newly acquired skills?
You’ll automatically get a certificate upon completing the course, which you can share or post on Linkedin.
Ready to join?